How to Read Game and Player Cards
by Will Roberts
If you are new to the Stat Cards universe, chances are pretty good you haven’t gotten the chance to check out Game Cards or Player Cards for your favorite team / player yet. These cards are our attempt to visualize the numbers and data that are used in evaluating the players and teams in an easy to understand format, quickly displaying the raw numbers, trends, and where a player may rank in a given category. In order to get the most out of the cards, this article will explain how to read and understand the information you are seeing displayed.
Followers of HockeyStatCards will be familiar with the layout, but some updates and tweaks have been made for ProFootballStatCards. The updates made aim to make things more clear, concise, and adjust for the fact that football is an entirely different sport than hockey. Keep reading below to check out some of the updates and to learn how to read the two primary forms of content the StatCards pages will provide.
Game Cards
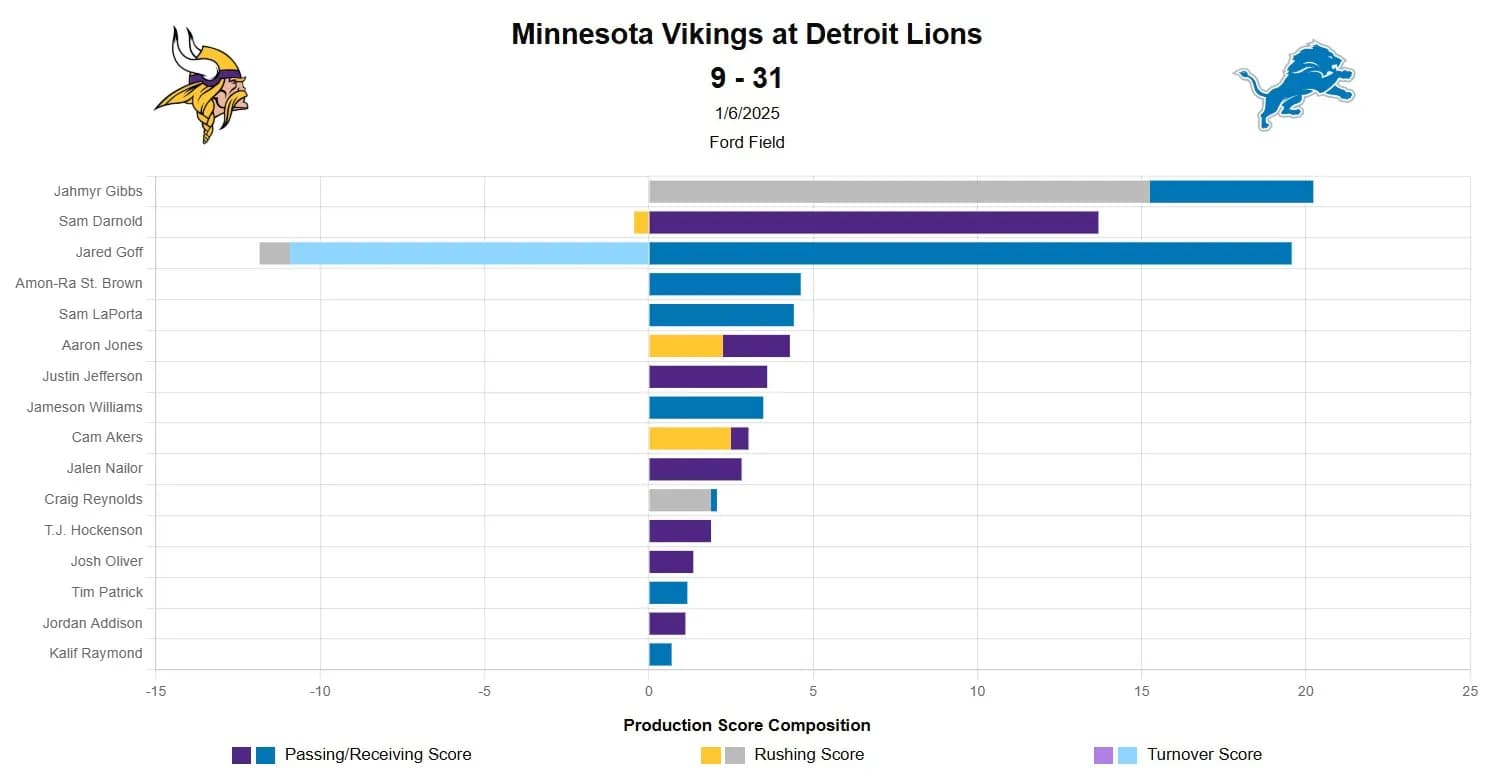
Up first we have Game Cards. In the ProFootballStatCards world, these cards display the Total Production Score for each player from both teams in any given game. These cards are sorted from the most productive player (highest Production Score) to the least productive player (lowest Production Score) for anyone who recorded data that week. If a player did not take a snap and had 0 production that game, they will be omitted from this card so the list doesn’t get too lengthy.
The Production Scores are broken down into the 3 main categories; Passing or Receiving Score, Rushing Score, and Turnover Score. The values are centered around 0, with positive values for Passing / Receiving / Rushing to the right, and negative values associated with Turnovers to the left. The team’s two primary colors are used to illustrate how much Production came from each positive component, with a diluted version of the primary color used to highlight the Turnover Score.
Player Cards

Player Card Donut
In contrast to the relative simplicity of the Game Cards, Player Cards provide a lot more information to give you insights into every detail behind your favorite players.
The first section you will likely notice are the PAR per Game Donuts. PAR stands for Production Above Replacement, and is a statistic that measures how productive a player is compared to the single median game by his position to this point in the season. A further explainer article on PAR can be found in another area of the ProFootballStatCards website, but its main advantage is that you can use PAR to compare production across different positions.
The values displayed in the donuts are the player’s average Passing PAR, Rushing PAR, and Total PAR per Game. The difference between Total PAR and the other PAR donuts displayed can be accounted for by looking at the player’s Turnover Score. These values are displayed on a per game basis to better control for injuries, bye weeks, and suspensions. If a player missed several games but was extremely productive in the games he played, we would see high PAR values here and be able to properly give him the credit where it’s due. It’s basically an efficiency metric to better control for missed games.
The amount of donut filled represents the percentile rank of each PAR category for the player amongst his peers. A rank of 100 would be shown by a complete donut and would indicate that this player is a more efficient producer than 100% of his peers. A rank of 50 would represent a half-eaten donut, and mean that the player is more efficient than half of his peers and less efficient than the other half. The donuts will also update their color on a continuous spectrum from dark red representing a rank of 0 to yellow at a rank of 50 and a dark green at a rank of 100.

Season Stat Bars
This section will be most familiar to fans of the game, as it is simply the season totals of each statistic for the given player. There are no accommodations for injuries in this case, we are looking to show the total value of each metric through that point in the season. This includes the player’s TOTAL Production Score, which is a linear model based on the other statistics provided. If you don’t know what Production Score is, go back and read our explainer article first to get a better understanding of this statistic.
Similar to the donuts, the color and fullness of the bar represent where the player ranks relative to his peers in that area. Same color grading scale, going from red (0) to green (100).

Week By Week Production Score Chart
In the lower left section of the Player Card is a graph illustrating the player’s total production in any given week. The player’s production is represented by the colored bar each week. The gray bar to the right of their Production Score is the median Production Score for their position in that week. This was designed to give viewers an immediate impression of how the player performed in a given week relative to the middle of the field for his position.
Breaking total Production Score down week-by-week can give a better impression of trends and can quickly allow for outliers, both good and bad over the course of the season.

Total Production Ranking Graph
Lastly, in the bottom right section you will find a graph representing the Player’s rank in their respective Passing, Receiving, Rushing, and Total Production throughout the season. Total Production is represented by the solid line, Passing or Receiving is represented by the dashed line, and Rushing Production is represented by the dots.
Again, the value reflected will indicate the player’s percent rank which tells you how many of his peers are at or below his Production level at that point in time. A line hovering near the top of this graph would mean the player is consistently performing better than a vast majority of his position.
Hopefully this explanation and these illustrations help provide some valuable insights into Players’ Production and how to read the Stat Cards. Cards may change as improvements are made over time, so feel free to suggest the improvements you want to see and they just might happen!